
Yingjun Mou


MedHotspot
Group Project for CSE6242 Data & Visual Analytics 09/2020
Motivation
Medhotspots is a smart search engine and data visualisation interface which is specialized in biomedical research papers. While most of the existing biomedical search tools fail to be user friendly and offer either inadequate or overwhelming search results , our project offer an accurate and concise solution to user's query. Based on the user input keyword, it will get a knowledge graph using multiple APIs such as PubMed. It will then offer a comprehensive visualization with recommendation of related high quality papers. We user experience, we invited 15 people including professional researchers in biomedical fields for the survey and the feedback are positive.
You can play the video below to watch a short demo:
Program Features
- The user will need to type in the search key word. Then, multiple csv files will be generated in the backend which yield the websites in the front.
- The homepage has our manifesto: we envision Medhotspot to be the best friend of biomedical researchers. There is also a brief introduction with our logo.
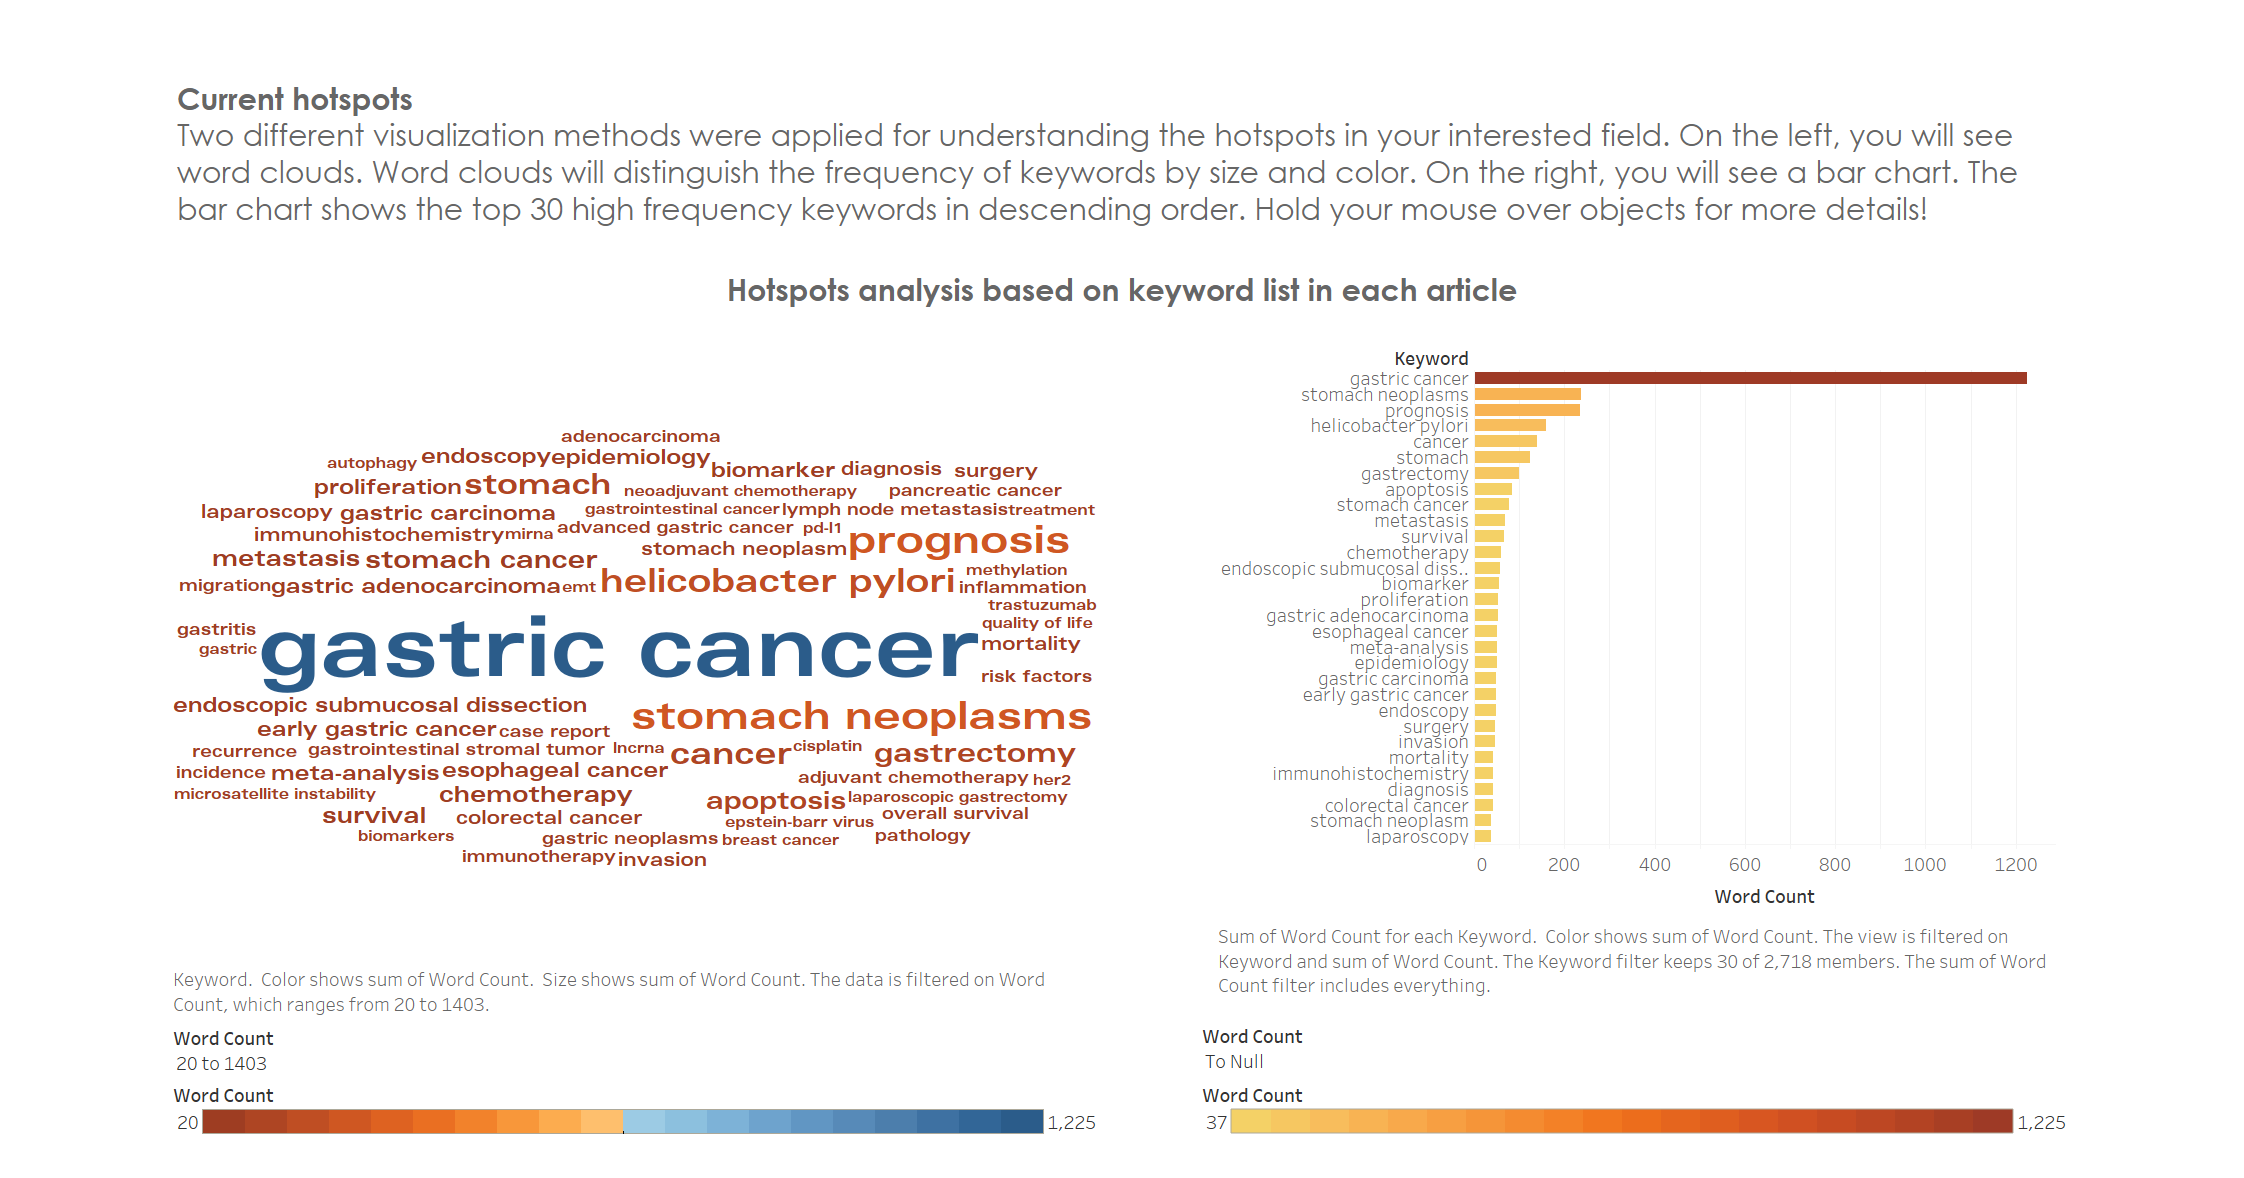
- The 2nd page is about the keyword analysis. The purpose of this page is to offer our users some alternatives of searching keyword if he/she wants to learn more about the topic.
Wordcloud visualize the frequencies of all the most related words from the 5000 query results. --- while larger size together with the darker color of the text indicate greater frequency.
On the side, on the other side, we use horizontal bar chart to further visualize the what are those most related keywords. Hovering the mouse over will show the specific occurrence of the words.
Similarly, there are another two chart analyzing the key words in the paper abstract. - For the 3rd page, we would like to provide an overview of how different countries and institutions across the globe have studied on the topic. So that when our user want to find a collaborator to work on this topic, he/she would get a better idea of where that potential collaborator would most likely to be.
- The information of the searched topic was not only shown in the conditionality of space, but also in the dimensionality of time. As we can see on the 4th page, which visualized how the topic was developed in the past few decades. And what journals include this topic the most. While the size indicates the occurrence in the journal, the color indicates the impact factor of the journal.
- After that, we also offer some recommendations of paper. We implemented the recommendation using k-means with considerations of factors such as the keywords, publish time, and the journal impact factor.
- Last but not the least, a survey page let users to express their user experience so that we can keep improving our system in the future.
 current hotspots
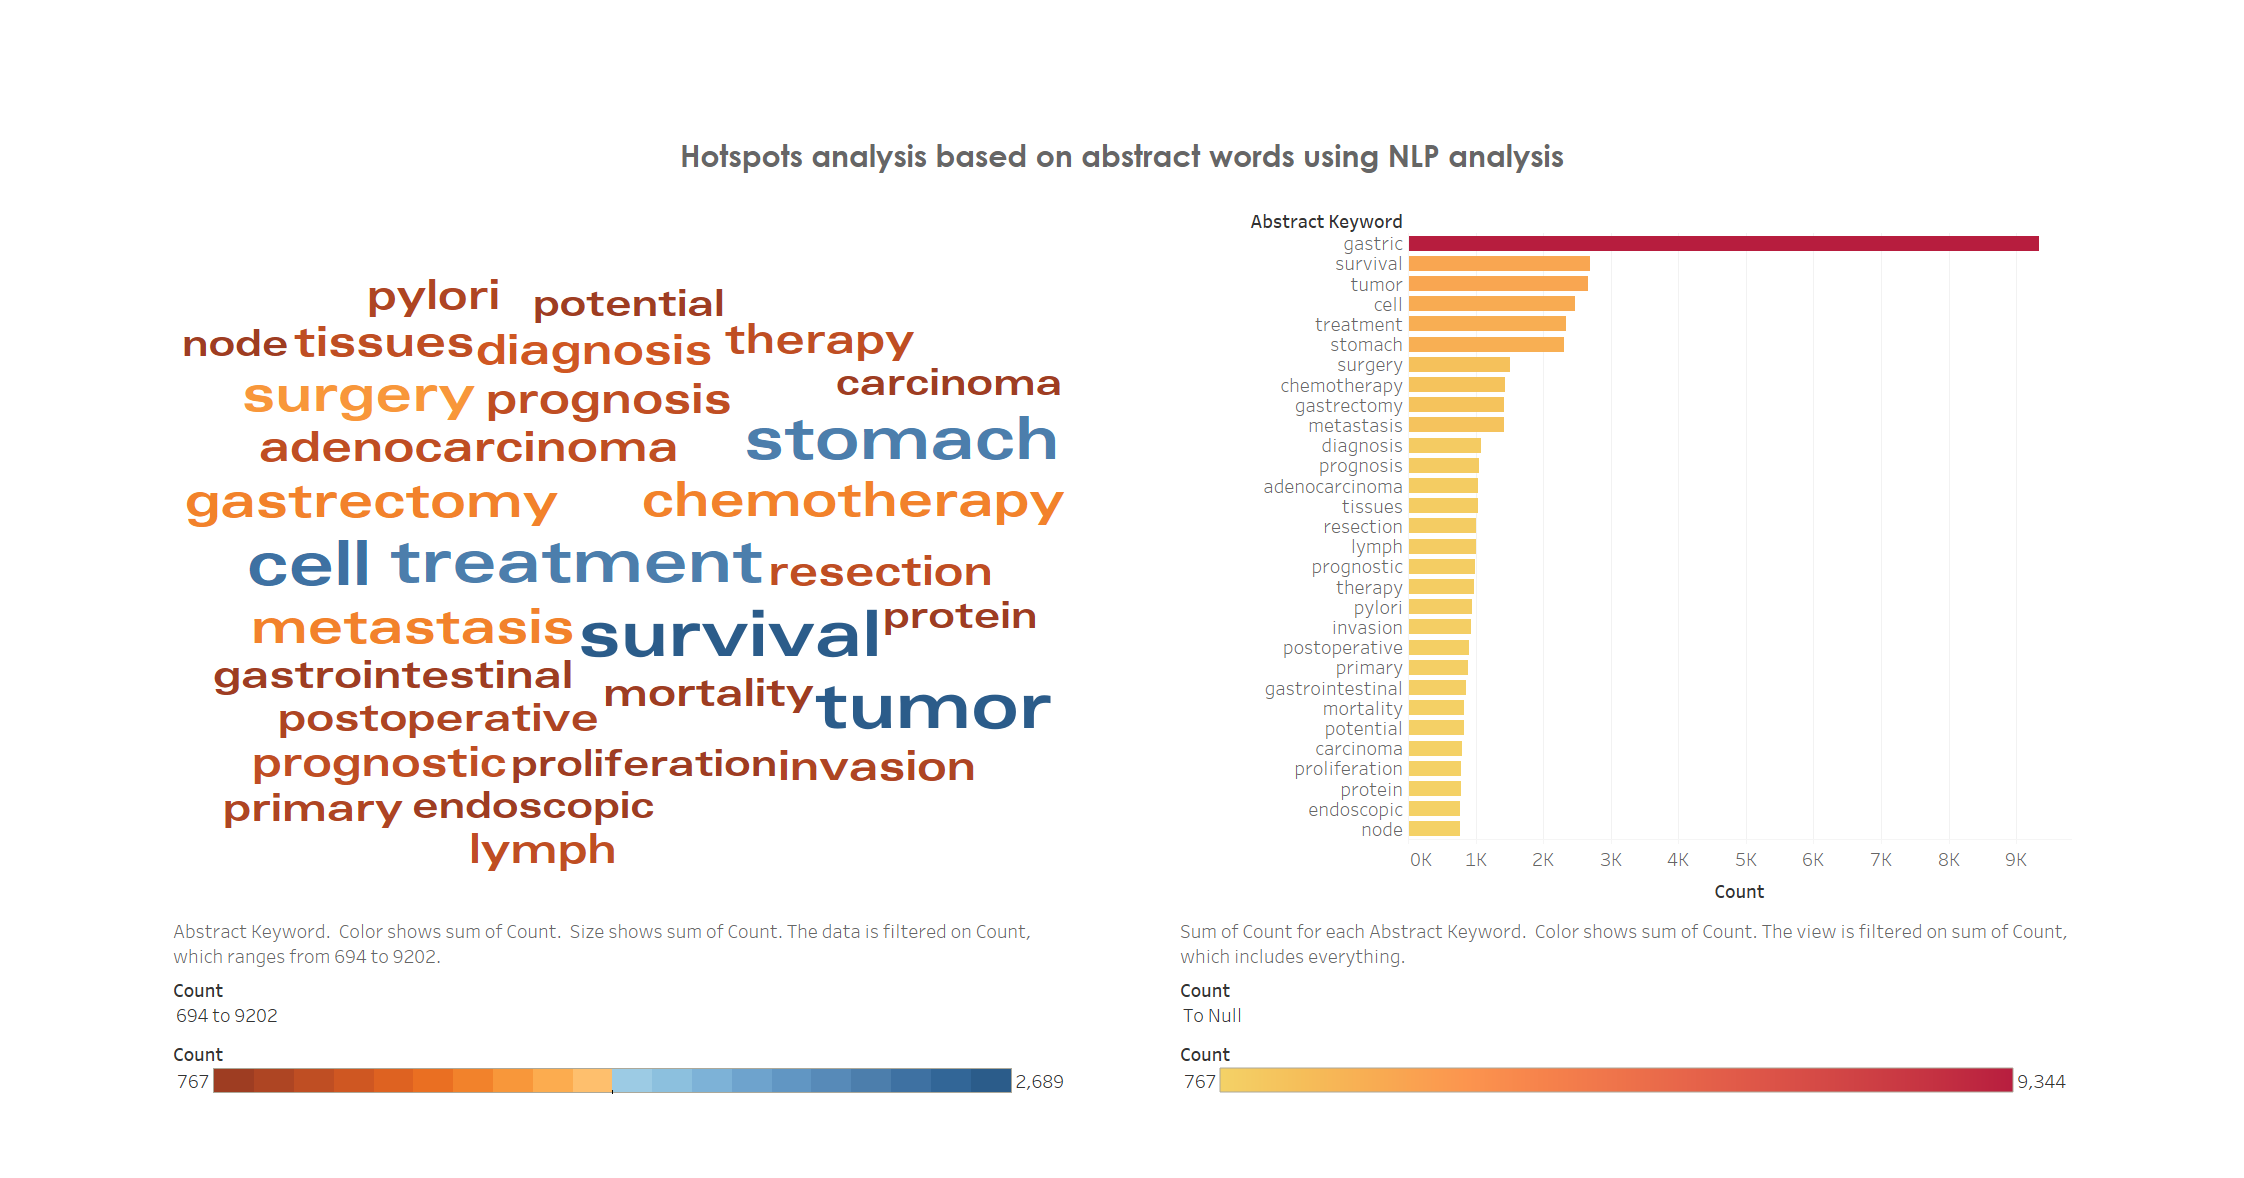 hotspot analysis based on abstract words
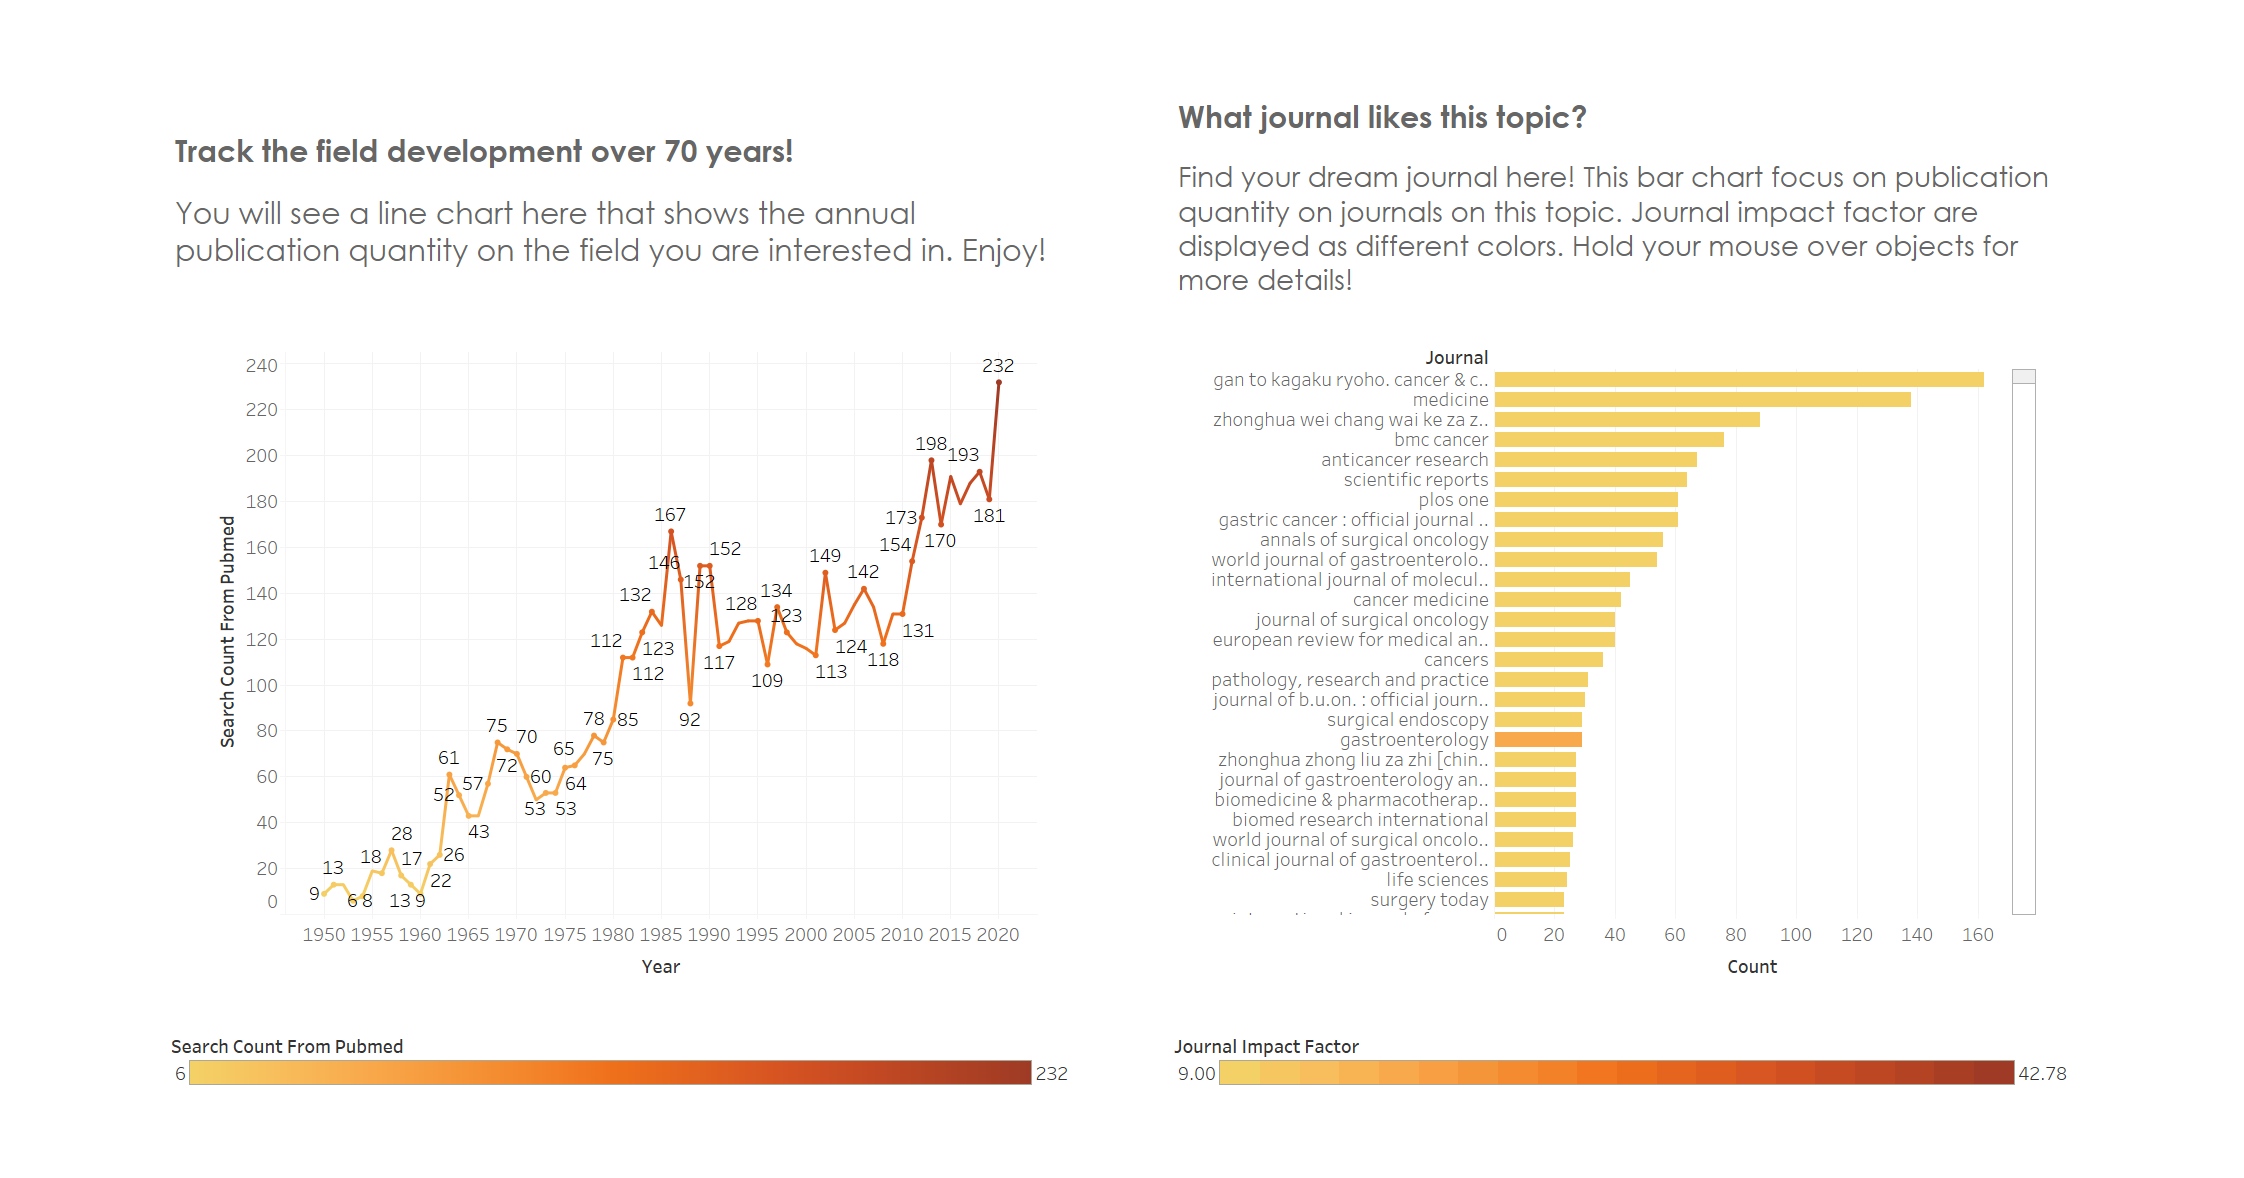 research trend of stomach cancer
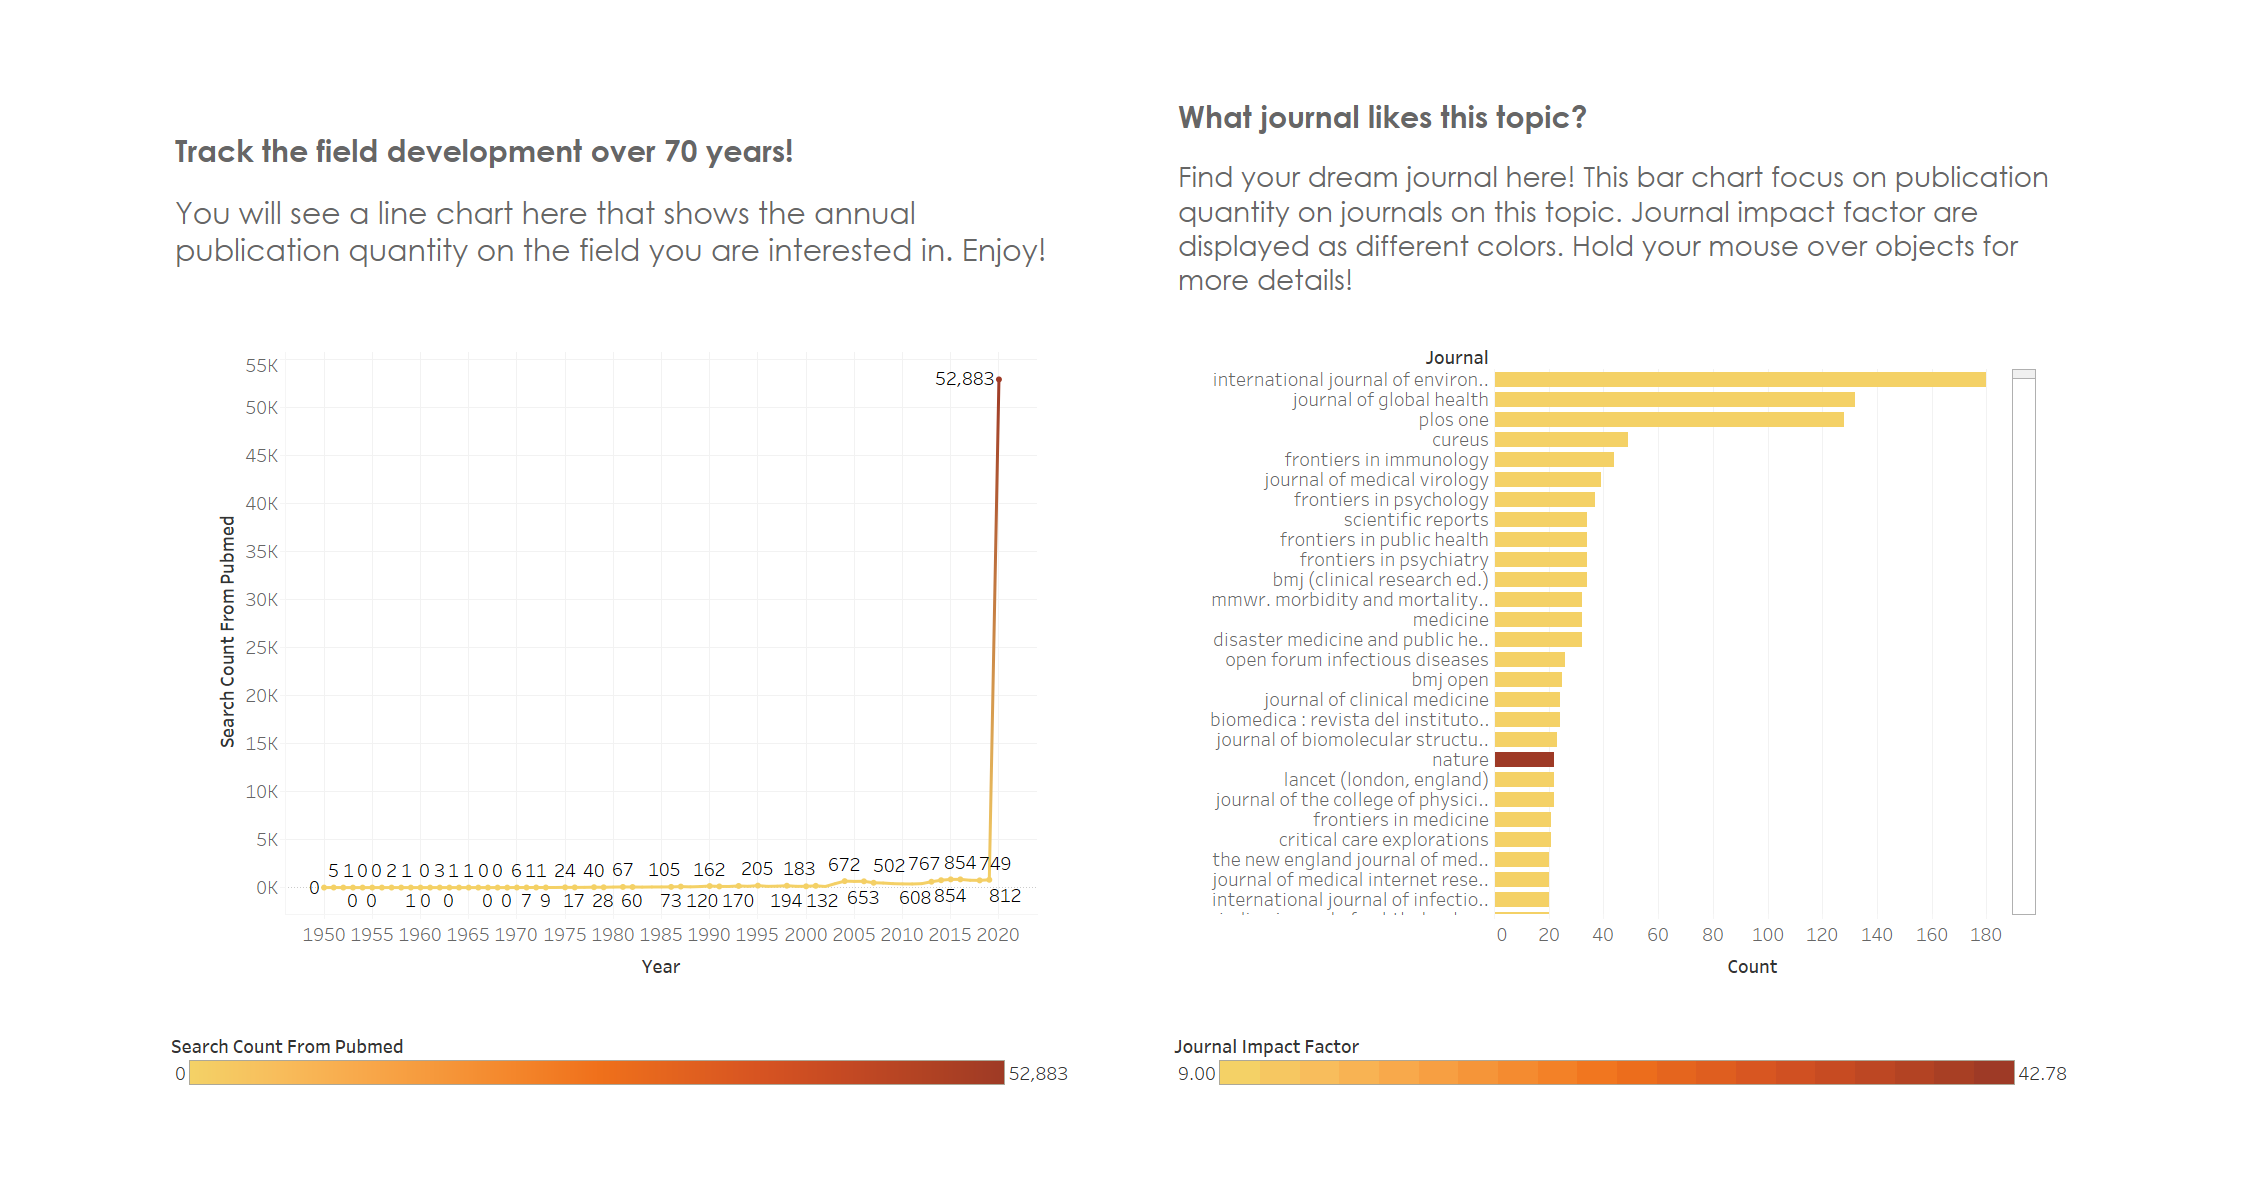 research trend of corona virus
Discovery
There are some interesting findings when we compare different serach words, for example, while stomach cancer has a very smooth increasing rate in the past few decades, the coronavirus have never been a hot topic until the pandemic outbreak this year. This shows that some topics are more time-sensitive than others, and the filter of time in MedHotspot successfully dresses the issue.
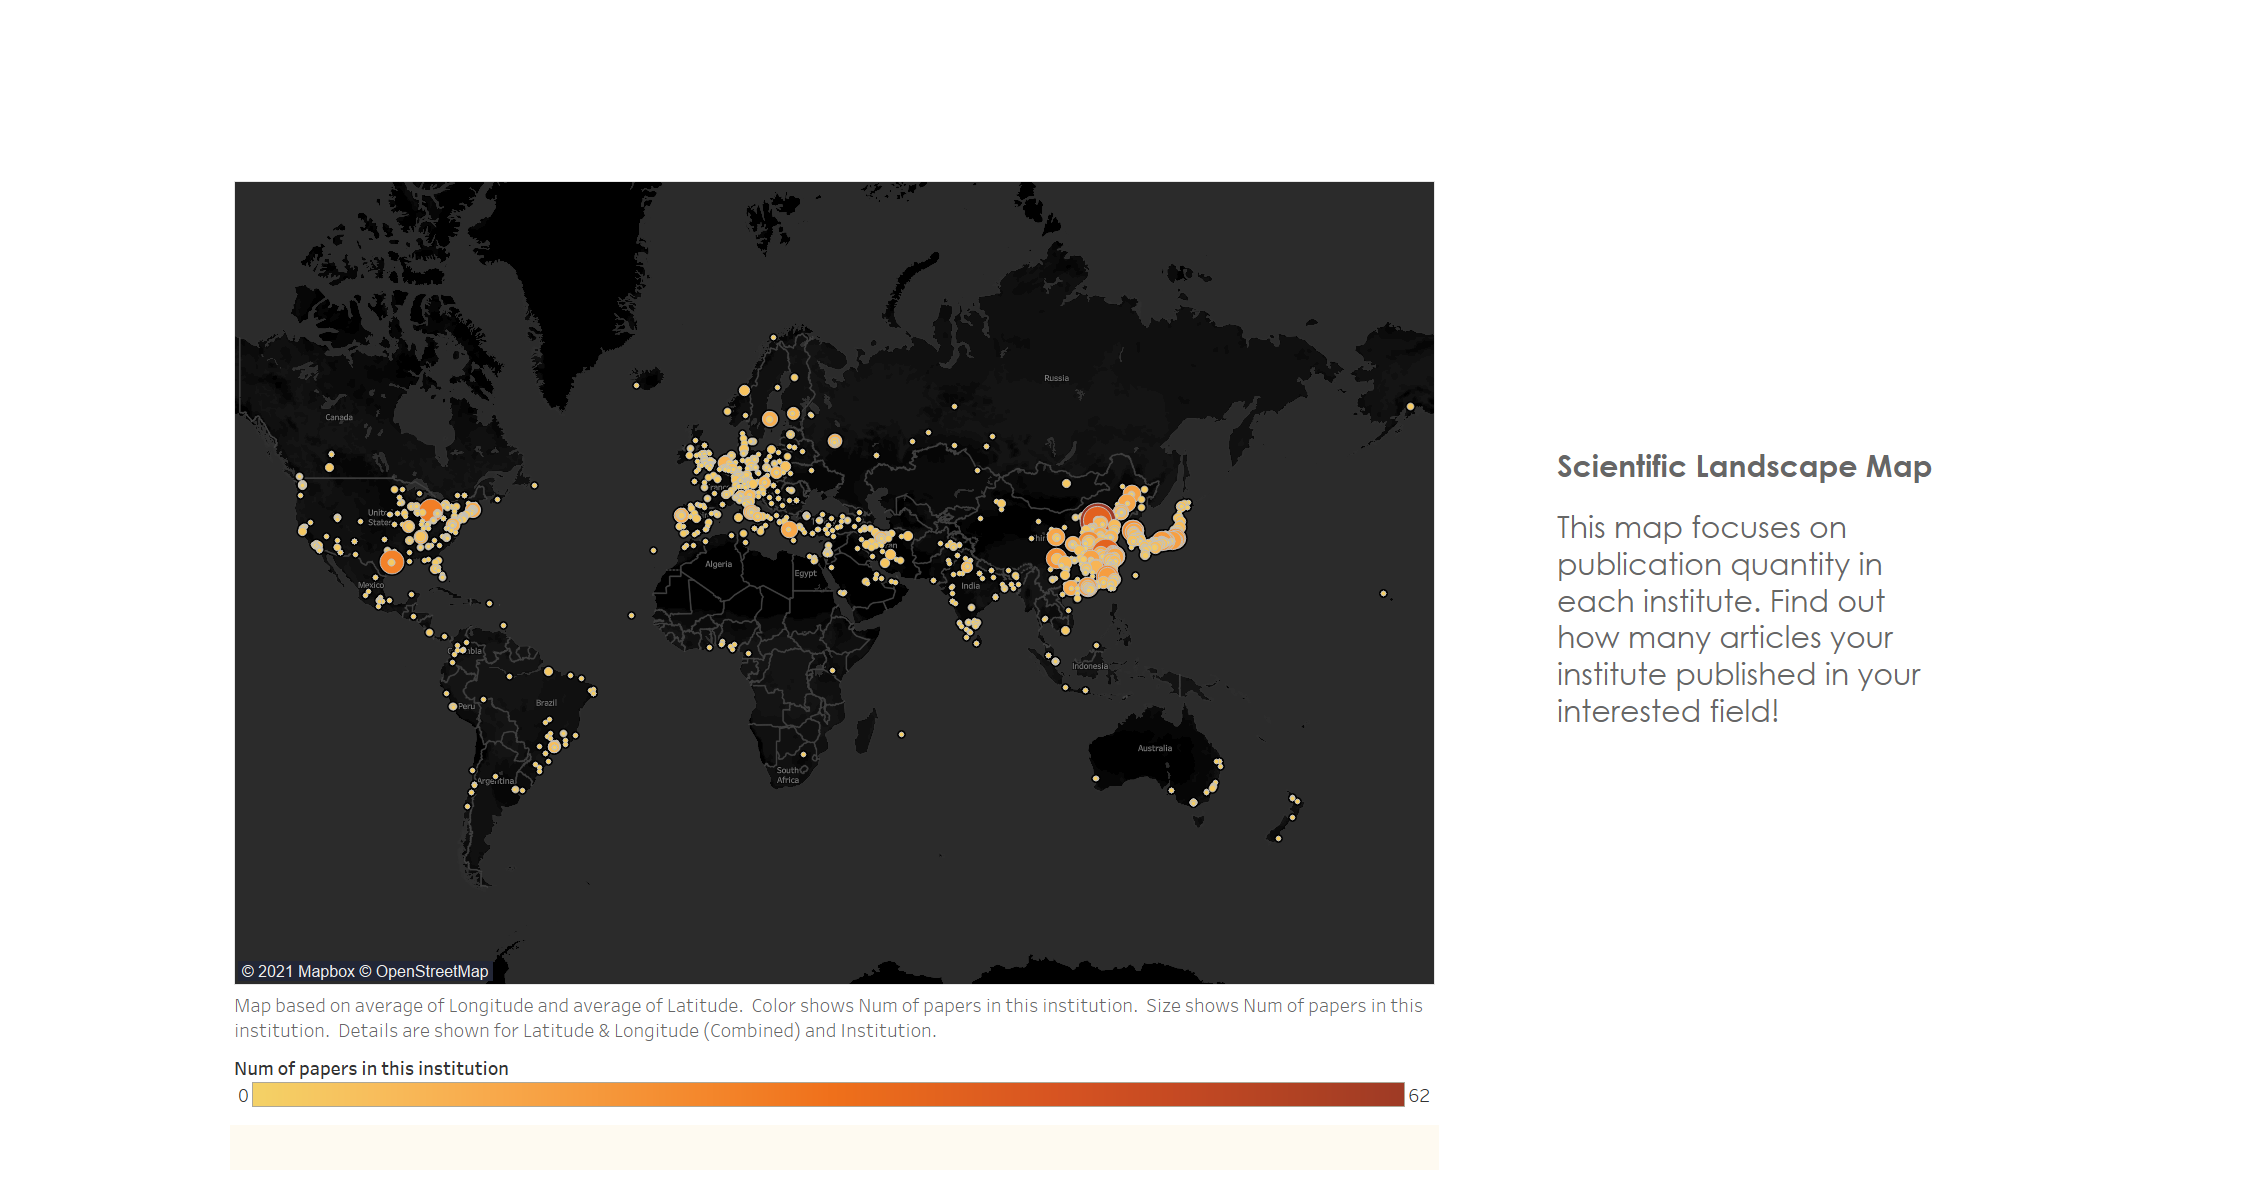 map of insitutions who are active researching on the topic
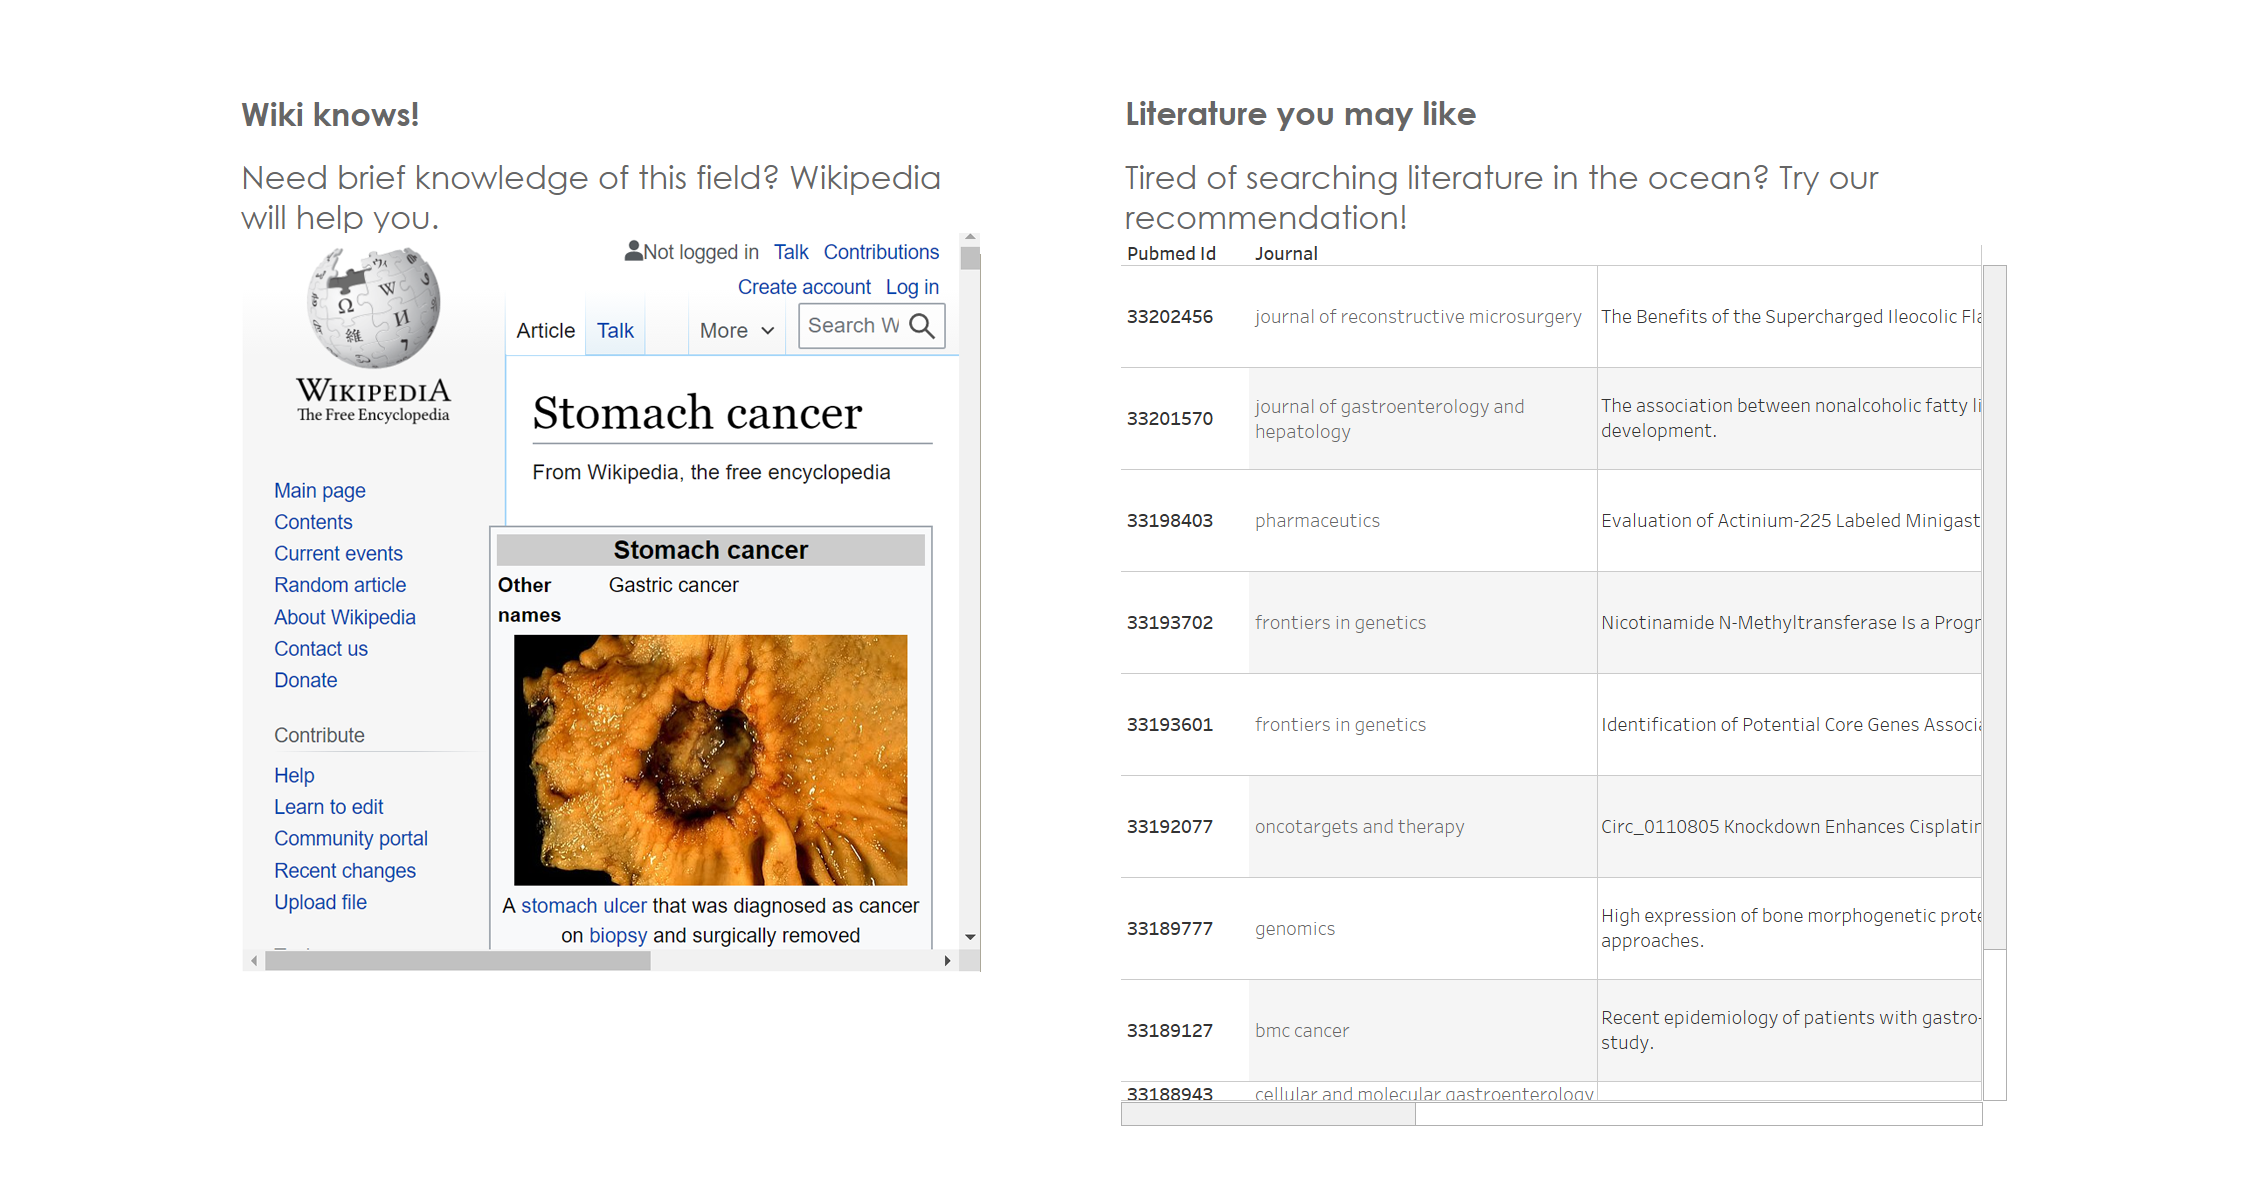 literature recommendations